from __future__ import division
import random
import pylab
import math
SAMPLES = 75
EPOCHS = 100
TESTS = 12
RUNS = 3
MOD = 12
def h(x):
"""Function to approximate: y = 0.5 + 0.4sin(2πx)."""
return 0.5 + 0.4*pylab.sin(pylab.pi*2*x)
def noise(x):
"""Add uniform noise in intervale [-0.1, 0.1]."""
return x + random.uniform(-0.1, 0.1)
def sample(n):
"""Return sample of n random points uniformly distributed in [0, 1]."""
a = [random.random() for x in range(n)]
a.sort()
return a
def gaussian(radial, x):
"""Return gaussian radial function.
Args:
radial: (num, num) of gaussian (base, width^2) pair
x: num of input
Returns:
num of gaussian output
"""
base, width2 = radial
power = -1 / width2 / 2 * (x-base)**2
y = pylab.exp(power)
return y
def output(radials, weights, x):
"""Return set of linearly combined gaussian functions.
Args:
radials: [(num, num) of (base, width^2) pairs
weights: [num] of radial weights, |weights| -1 = |radials|
x: num of input
Returns:
num of linear combination of radial functions.
"""
y = 0
for radial, weight in zip(radials, weights[:-1]):
y += gaussian(radial, x) * weight
y += weights[-1]
return y
def update_weights(eta, weights, radials, x, y, d):
"""Update weight vector.
Returns:
[num] of updated weight vector, len = |weights|
"""
new_weights = []
err = d-y
for radial, weight in zip(radials, weights[:-1]):
w = weight + (eta * err * gaussian(radial, x))
new_weights.append(w)
w = weights[-1] + (eta * err)
new_weights.append(w)
return new_weights
def k_means(input, k):
"""Return n Gaussian centers computed by K-means algorithm from sample x.
Args:
input: [num] of input vector
k: int number of bases, <= |set(input)|
Returns:
[(num, [num])] k-size list of (center, input cluster) pairs.
"""
bases = random.sample(set(input), k)
clusters = [ (x, 0) for x in input ]
updated = True
while(updated):
updated=False
for i in range(0, len(clusters)):
x, m = clusters[i]
distances = [(abs(b-x), j) for j, b in enumerate(bases)]
d, j = min(distances)
if m != j:
updated = True
clusters[i] = (x, j)
if updated:
base_sums = [ [0,0] for s in range(k)]
for x, m in clusters:
base_sums[m][0] += x
base_sums[m][1] += 1
new_bases = []
for s, n in base_sums:
if n == 0:
base = random.sample(set(input), 1)[0]
else:
base = s / n
new_bases.append(base)
bases = new_bases
response = [ (b, []) for b in bases ]
for x, m in clusters:
response[m][1].append(x)
return response
def variance_width(k_meaned_x):
"""Return mean, variance pairs computed from k_means(x, k).
Args:
k_meaned_x: [(num, [num])] of (base, input cluster) pairs
Returns:
[(num, num)] of (center, width^2) pairs.
"""
response = []
for base, cluster in k_meaned_x:
if len(cluster) > 1:
var = sum([(base-x)**2 for x in cluster]) / len(cluster)
else:
var = None
response.append((base, var))
vars = [v for b, v in response if v]
if len(vars) == 0:
raise Exception("No variance: cannot compute mean variance")
else:
var_mean = sum(vars) / len(vars)
for i in range(len(response)):
base, var = response[i]
if not var:
response[i] = (base, var_mean)
return response
def shared_width(k_meaned_x):
"""Return shared gaussian widths computed from k_means(x, k).
Args:
k_meaned_x: [(num, [num])] of (base, input cluster) pairs
Returns:
[(num, num)] of (center, width^2) pairs.
"""
assert(len(k_meaned_x) > 1)
bases = [b for b, cluster in k_meaned_x]
s_bases = bases[:]
s_bases.sort()
distances = map(lambda p: abs(p[0]-p[1]), zip(s_bases, s_bases[1:]))
max_d = max(distances)
sigma_sq = (max_d / 2**0.5)**2
response = [(b, sigma_sq) for b in bases]
return response
def plot_instance(name, x, ideal_y, measured_y, trained_y, new_x, estimated_y):
"""Plot function graph, save to file.
Effect: saves png file of plot to currect directory.
NOTE: use local graph variable
Args:
name: str of plot name, used in file name like "name.png"
x: [num] input vector
ideal_y: [num] ideal output vector
measured_y: [num] noisy output vector
trained_y: [num] trained output vector
new_x: [num] new input sample not used in training
estimated_y: [num] estimated output from trained RBN
"""
pylab.rc('text', usetex=True)
pylab.rc('font', family='serif')
pylab.xlabel('$x$')
pylab.ylabel('$y = 0.5 + 0.4\sin(2 \pi x)$')
pylab.title('RBF Network: %s' % name)
pylab.plot(x, ideal_y, 'g', label="Ideal")
pylab.plot(x, measured_y, 'bo', label="Measured")
pylab.plot(x, trained_y, 'y', label="Trained")
pylab.plot(new_x, estimated_y, 'r', label="Generalized")
pylab.legend()
filename = name
filename = filename.replace(' ', '_').replace('\\', '').replace('$', '')
filename = filename.replace(',', '')
pylab.savefig("%s.png" % filename)
pylab.clf()
pylab.cla()
def error(actual, expected):
"""Return error from actual to expected.
Args
actual: [num] of sampled output
expected: [num] of expected ouput, ||expected|| = ||actual||
Returns:
num of average distance between actual and expected
"""
sum_d = 0
for a, e in zip(actual, expected):
sum_d += abs(a-e)
err = sum_d / len(expected)
return err
def run_test(eta, k, tests=TESTS, runs=RUNS, f_width=variance_width, graph_mod=MOD):
"""Run an RBF training test set; plot, return errors from results.
Args:
eta: num of training rate
k: num of bases
tests: num of sample set iterations
runs: num of network generation iterations
f_width: function to generate radial widths
graph_mod: num of after how many iterations to plot a graph
Returns:
{str: [num]} such that n = (tests*runs) and:
"sample_err": [num] of n sampling errors
"train_err": [num] of n training errors
"gen_err": [num] of n estimation errors
"""
results = {
"sample_err": [],
"train_err": [],
"gen_err": [],
}
f_name = f_width.__name__.capitalize().split('_')[0]
for test in range(1,tests+1):
print "## K=%d, eta=%.2f, Test=%d" % (k, eta, test)
input = sample(SAMPLES)
test_input = sample(SAMPLES)
ideal_y = map(h, input)
test_ideal_y = map(h, test_input)
measured_y = map(noise, ideal_y)
for run in range(1,runs+1):
radials = f_width(k_means(input, k))
weights = [random.uniform(-0.5, 0.5) for x in range(k+1)]
for i in range(EPOCHS):
for x, d in zip(input, measured_y):
y = output(radials, weights, x)
weights = update_weights(eta, weights, radials, x, y, d)
trained_y = map(lambda x: output(radials, weights, x), input)
estimated_y = map(lambda x: output(radials, weights, x), test_input)
sample_err = error(measured_y, ideal_y)
train_err = error(trained_y, measured_y)
gen_err = error(estimated_y, test_ideal_y)
results["sample_err"].append(sample_err)
results["train_err"].append(train_err)
results["gen_err"].append(gen_err)
iteration = (test-1)*runs + run
if (iteration % graph_mod) == 0:
name = "%s $K=%d, \eta =%.2f, E=%.3f$ (%d-%d)" % \
(f_name, k, eta, gen_err, test, run)
plot_instance( \
name, input, ideal_y, measured_y, trained_y, test_input, estimated_y)
return results
def stats(values):
"""Return tuple of common statistical measures.
Returns:
(num, num, num, num) as (mean, std, min, max)
"""
mean = sum(values) / len(values)
sum_sqs = reduce(lambda x, y: x + y*y, values)
var = sum([(mean-x)**2 for x in values]) / len(values)
var = (sum_sqs - len(values)*mean**2) / len(values)
std = var**0.5
min_var, max_var = min(values), max(values)
return (mean, std, min_var, max_var)
def main():
random.seed()
for f_width in (variance_width, shared_width):
for eta in (0.01, 0.02):
for k in (5, 10, 15, 20, 25):
print ""
print "BEGIN PARAMETER TEST SUITE"
print "K=%d, eta=%.2f, f_width=%s, Tests=%d, Runs=%d" % \
(k, eta, f_width.__name__, TESTS, RUNS)
print "+++++++++++++++++++++++++++++++++++"
r = run_test(k=k, eta=eta, f_width=f_width)
print "+++++++++++++++++++++++++++++++++++"
print "RESULTS"
print "K=%d, eta=%.2f, f_width=%s, Tests=%d, Runs=%d" % \
(k, eta, f_width.__name__, TESTS, RUNS)
for name, values in r.items():
print name
print "mean=%.4f, std=%.4f, min=%.4f, max=%.4f" % \
stats(values)
print "+++++++++++++++++++++++++++++++++++"
if __name__ == "__main__":
main()
|

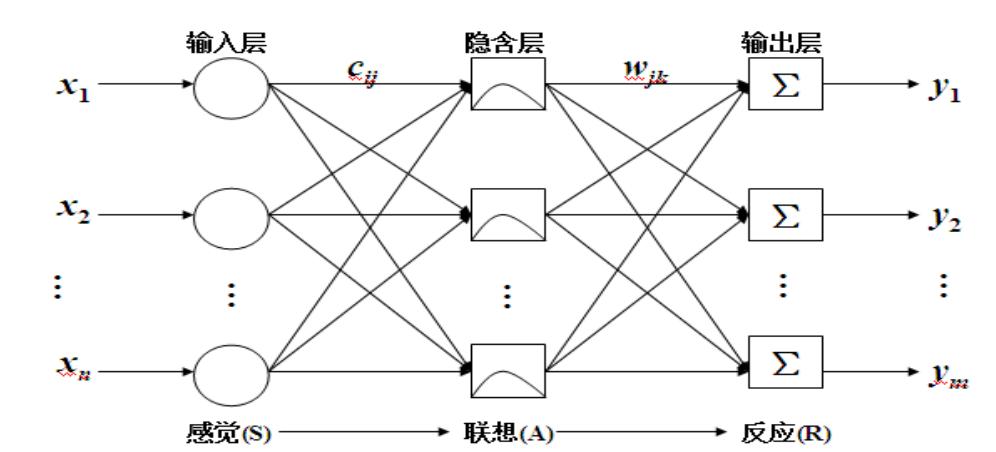
 为自变量的。径向神经网络的激活函数一般表达式为
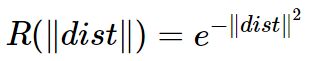
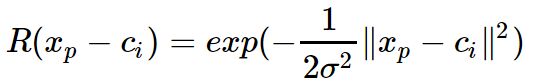

 与中心为
与中心为 之中。
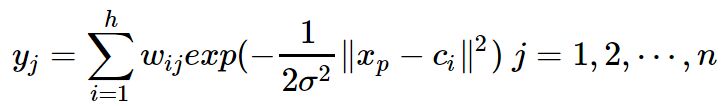
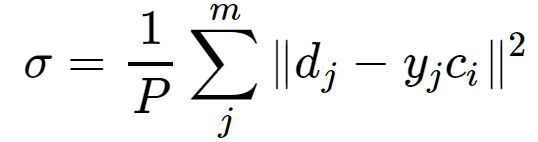
之中。 可由下式求解得出:
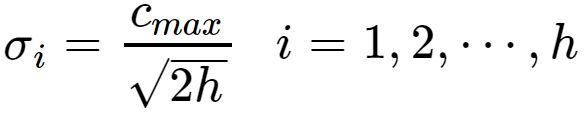
 是所选取中心之间的最大距离.
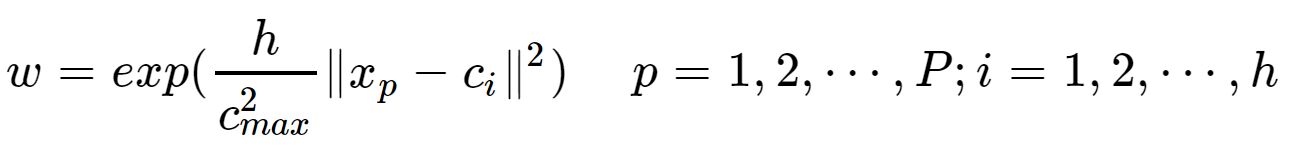
 wechat
 alipay