如何用 Python 语言绘制谷歌地图

原文:https://www.javatpoint.com/how-to-plot-the-google-map-using-folium-package-in-python

leaf 包建立在 Python 生态系统的数据争论优势和 JavaScript 语言的leaf.js 库的映射优势之上。用户可以使用 Python 操作他们的数据,然后通过叶包使用leaf.js 地图将其可视化。leaf package 是一种将数据可视化到 Leaflet.js 地图上的简单方法,该地图已经使用 Python 进行了操作。

必需的模块和库

**Folium:**用户可以使用以下命令安装叶包。


pip install folium

**Geopy:**Python 的 Geopy 模块让 Python 用户可以轻松定位地球表面的地标、城市、国家的坐标。要安装 geopy 模块,用户可以使用以下命令:


pip install geopy

成功安装两个库后,我们按照以下步骤绘制谷歌地图。

步骤 1:创建基础地图

用户可以使用以下程序创建基础地图:


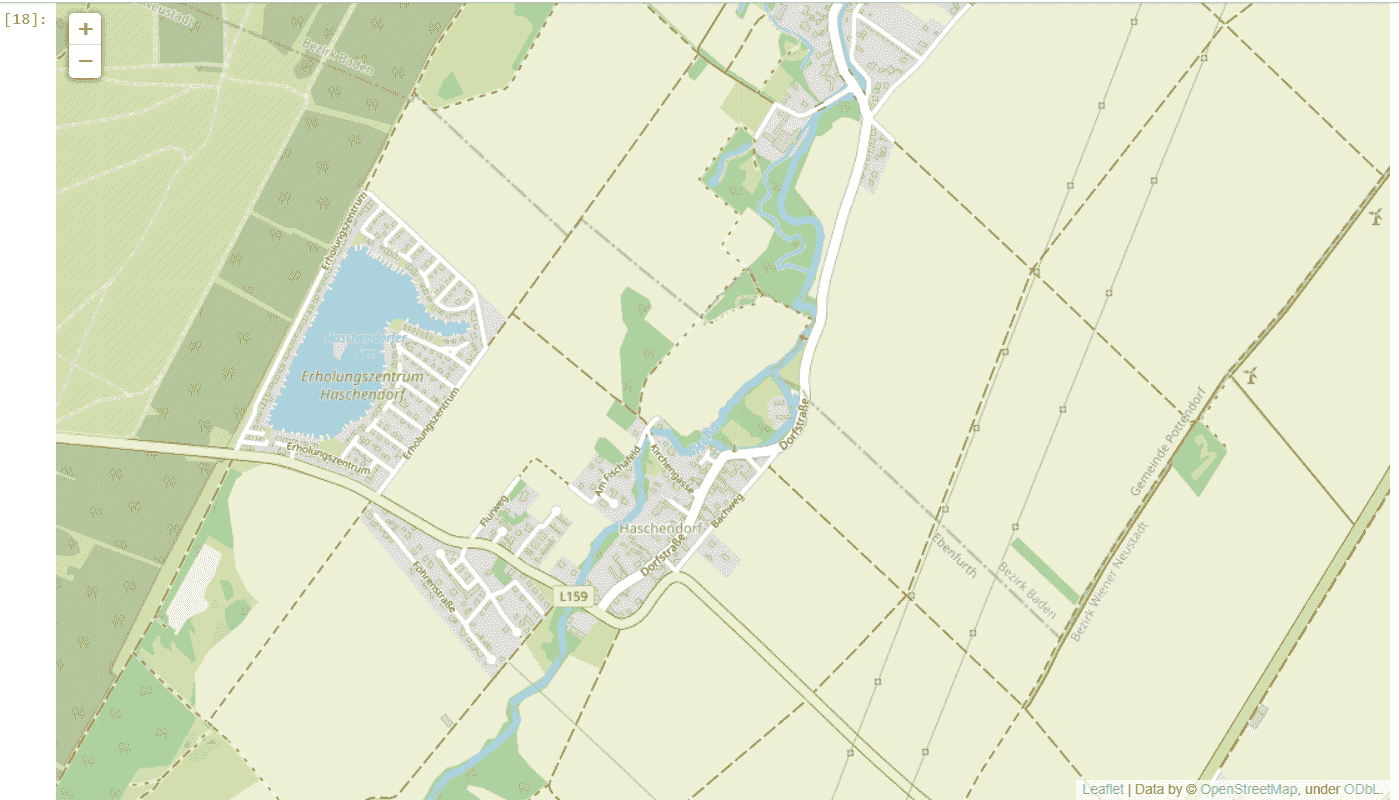
import os
# First, import folium package
import folium
from geopy.geocoders import Nominatim as NT
# Initialize Nominatim API
geo_locator = NT(user_agent = "geoapiExercises")
# write the place
place_1 = "Yemen"

location_1 = geo_locator.geocode(place_1)
# now, it will search for the location by using the latitude and longitude, with zoom_start = 15
user_map1 = folium.Map(location = [location_1.longitude, location_1.latitude],
zoom_start = 15 )
# At last, open the base map
user_map1

输出:

How to Plot the Google Map using folium package in Python

步骤 2:添加圆形标记

用户可以使用以下代码用圆圈和弹出文本标记该区域:


import folium

from geopy.geocoders import Nominatim as NT

geo_locator = NT(user_agent = "geoapiExercises")

place_1 = "Yemen"

location_1 = geo_locator.geocode(place_1)

user_map1 = folium.Map(location = [location_1.longitude, location_1.latitude],
zoom_start = 15 )

# CircleMarker with radius
folium.CircleMarker(location = [location_1.longitude, location_1.latitude],
radius = 45, popup = ' YEMEN ').add_to(user_map1)

# Now, open the Map with circular Mark
user_map1

输出:

How to Plot the Google Map using folium package in Python

步骤 3:用弹出文本为降落伞样式标记添加简单标记

用户可以使用以下代码。

示例-


import os
import folium

from geopy.geocoders import Nominatim as NT

geo_locator = NT(user_agent = "geoapiExercises")

place_1 = "Yemen"

location_1 = geo_locator.geocode(place_1)

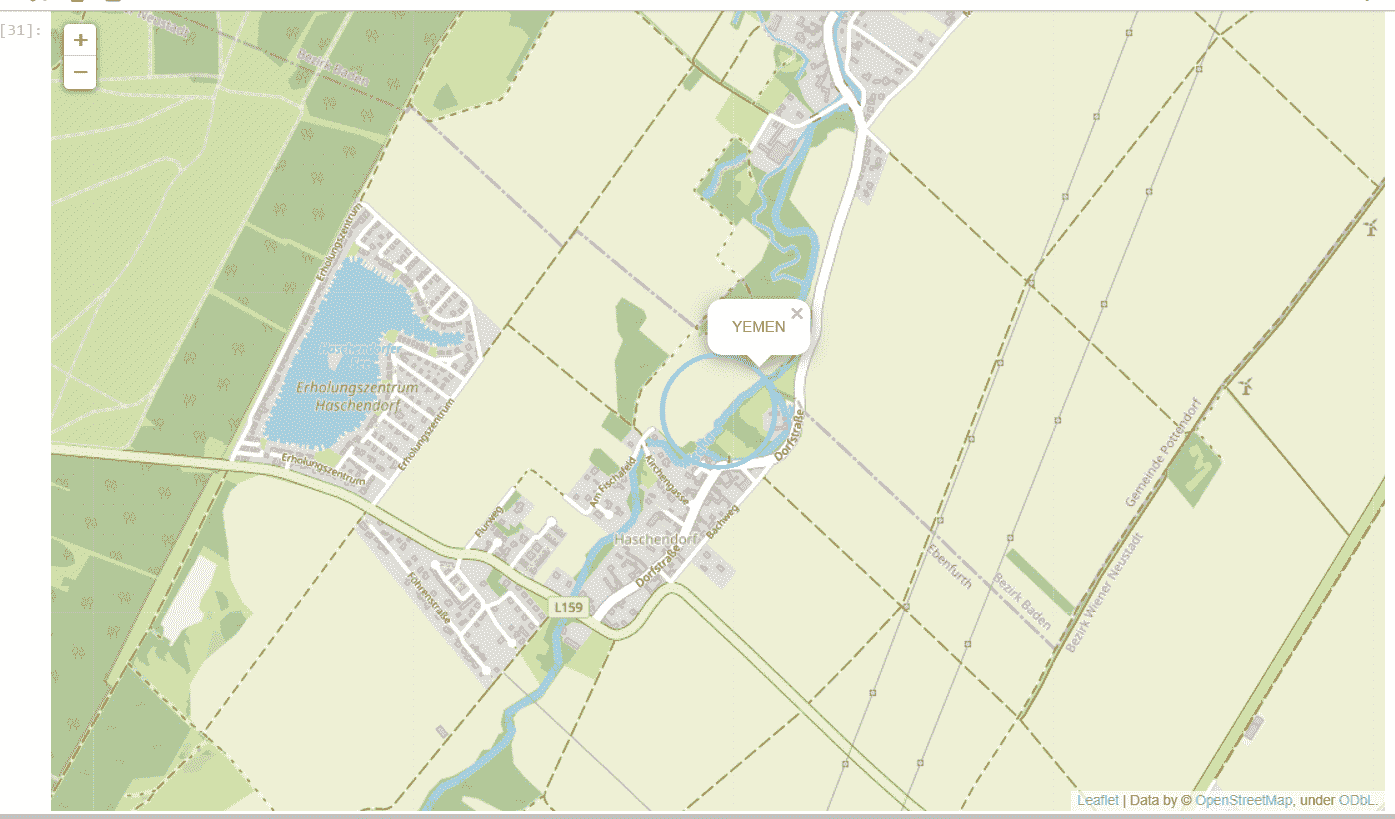
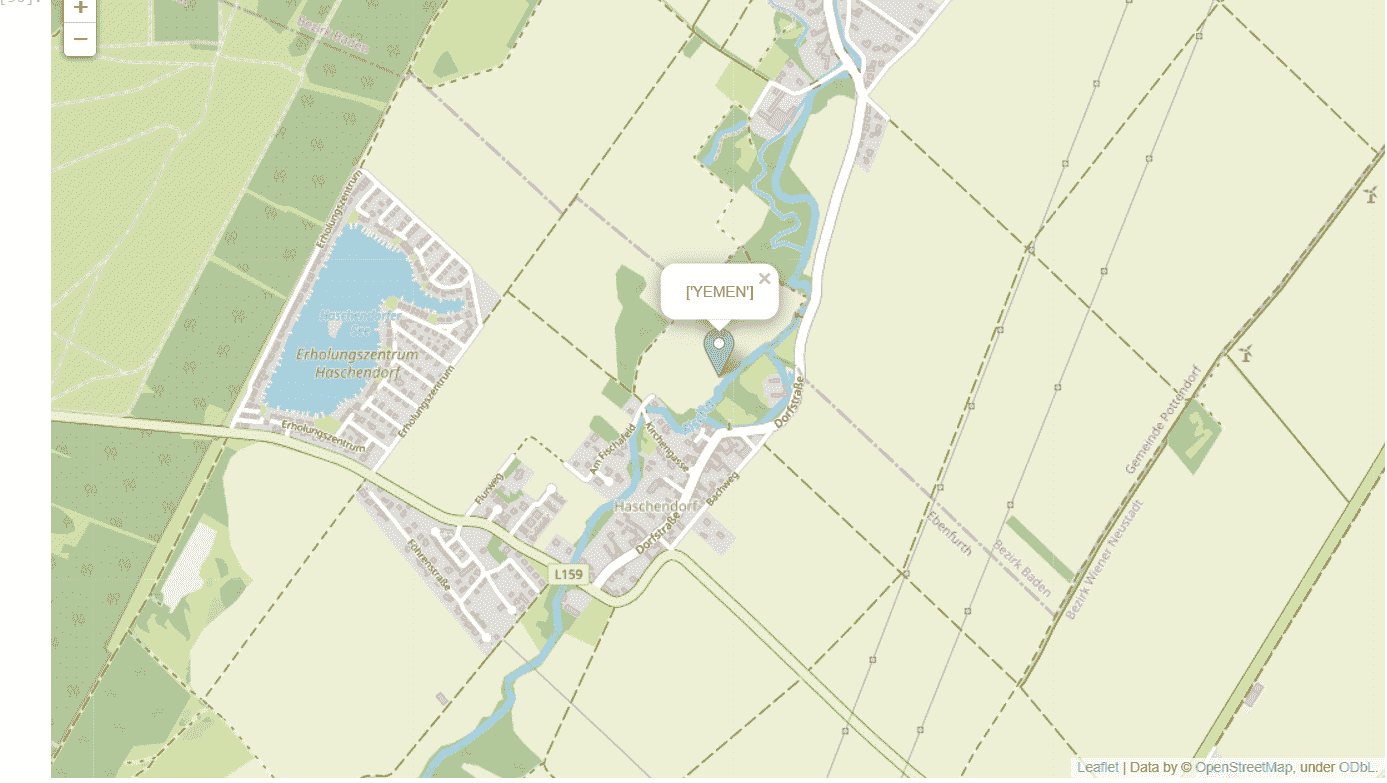
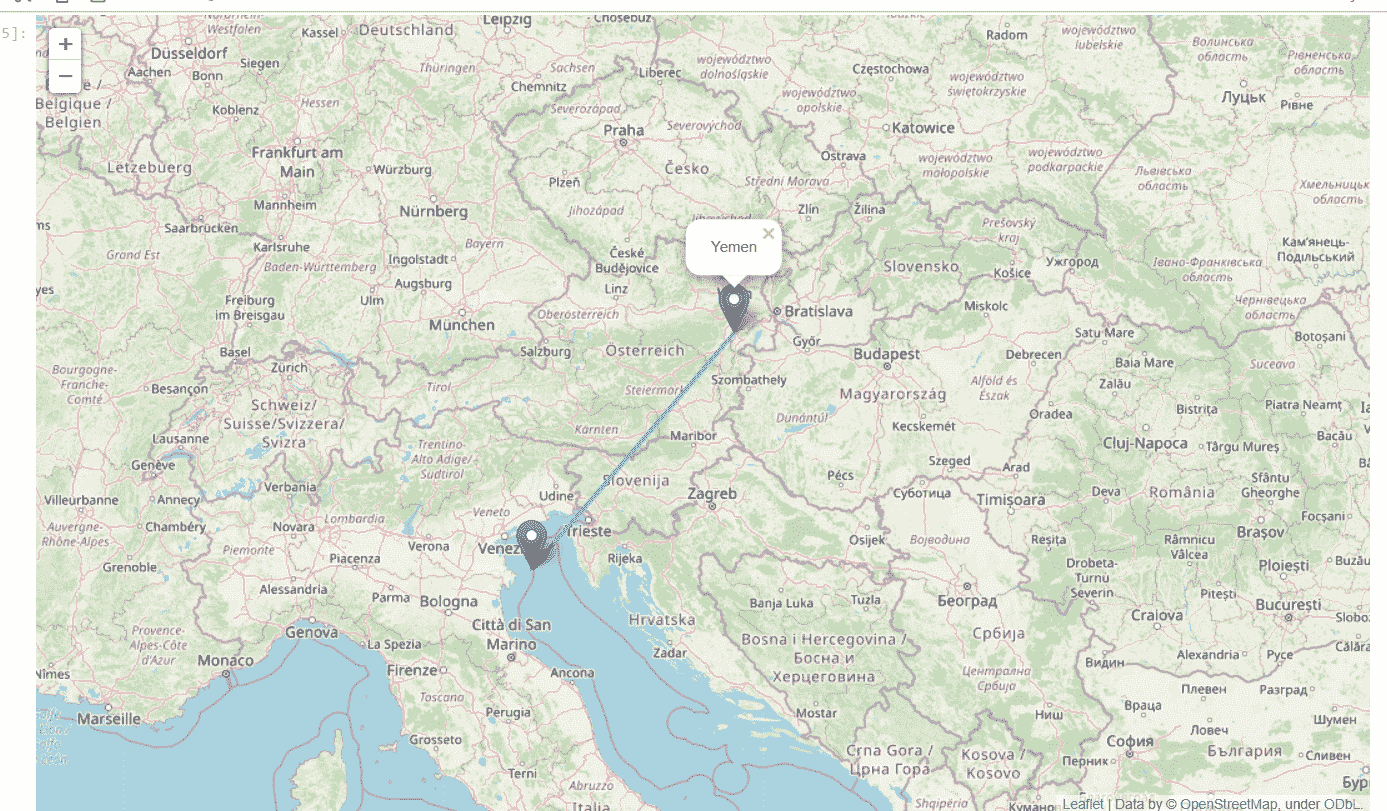
user_map1 = folium.Map(location = [location_1.longitude, location_1.latitude],
zoom_start = 15)
#Now, we will pass the string in popup parameter
folium.Marker([location_1.longitude, location_1.latitude],
popup = ['YEMEN']).add_to(user_map1)
# now, open the map
user_map1

输出:

How to Plot the Google Map using folium package in Python

第四步:在地图上添加线条

用户可以使用以下代码在地图上添加直线来连接两个坐标。

示例-


# First, import folium package
import folium
import os
from geopy.geocoders import Nominatim as NT

geo_locator = NT(user_agent = "geoapiExercises")

place_1 = "Aden"
place_2 = "Yemen"
location_1 = geo_locator.geocode(place_1)
location_2 = geo_locator.geocode(place_2)
user_map1 = folium.Map(location = [location_1.longitude, location_1.latitude],
zoom_start = 6)

folium.Marker([location_1.longitude, location_1.latitude],
popup = ['Aden']).add_to(user_map1)

folium.Marker([location_2.longitude, location_2.latitude],
popup = 'Yemen').add_to(user_map1)

# Now, we will add the line on the map by using Polyline method .
# it will connect both coordinates by the line

folium.PolyLine(locations = [[location_1.longitude, location_1.latitude], [location_2.longitude, location_2.latitude]],
line_opacity = 0.5).add_to(user_map1)
# now, open the map
user_map1

输出:

How to Plot the Google Map using folium package in Python

解释

我们使用geopy库来获取位置的经纬度。然后我们使用folium包的folium.map方法创建谷歌地图的基础。

在步骤 2 中,我们使用“folium.CircleMarker,用于用弹出文本在位置上标记圆形标记。在第三步中,我们使用了“folium.Marker,在所述位置添加降落伞样式标记。最后一步,我们用“folium.PolyLine“用于连接地图上两个不同位置的两个标记。

结论

在本教程中,我们展示了用户如何绘制谷歌地图,并在地图上添加不同的所需功能,如圆形标记、降落伞标记、弹出文本以及连接地图上两个坐标的线条。